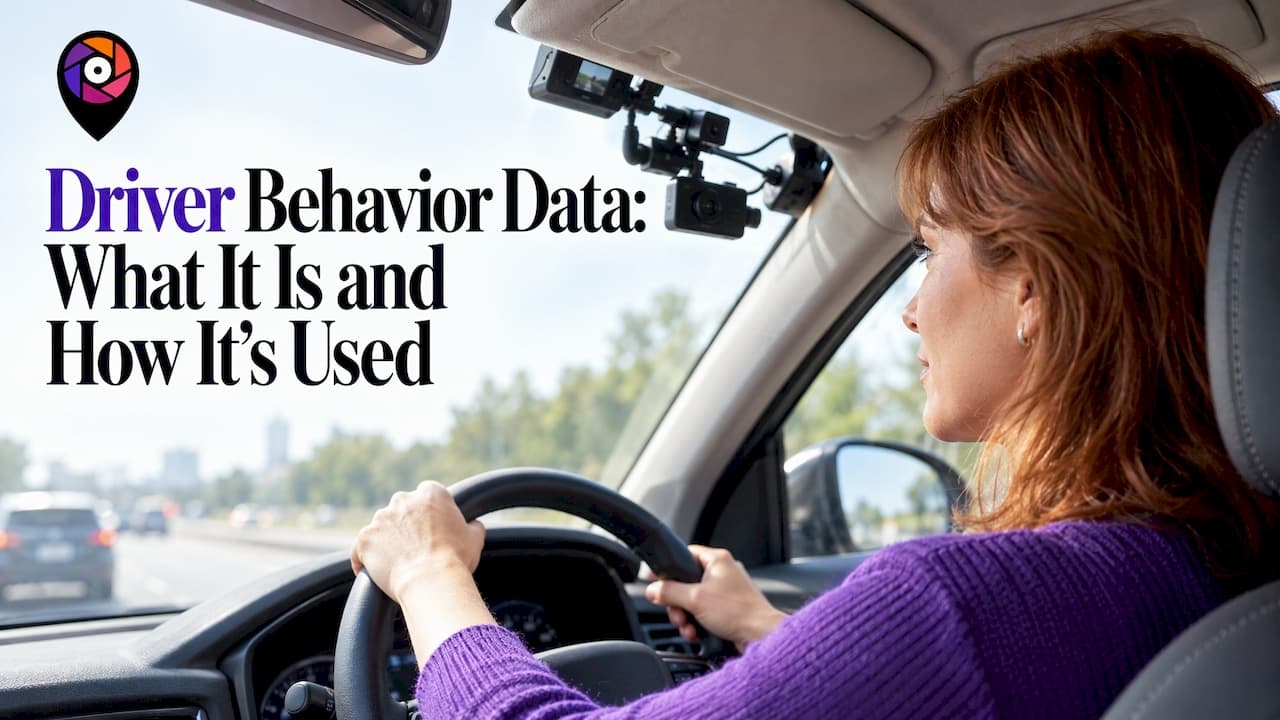
Driver behavior data is the record of how a person actually drives: how fast, how hard they brake, how sharply they corner, whether they touch their phone, and what happens on the road around them. It comes from vehicle sensors, smartphones and cameras, and insurers, fleets, researchers and traffic agencies use it to find risk before it becomes a crash. This guide covers what the data contains, how it is collected and analyzed, where it can mislead, and what to know about privacy.
TL;DR
- Driver behavior data describes control actions (steering, braking, acceleration), choices (speed, lane changes) and distractions, captured by sensors, GPS, phones and video.
- Smartphones are now a main collection tool: the accelerometer and gyroscope can reveal hard braking, aggressive turns and phone handling.
- Phone-based measurements can overstate critical events, so good systems account for device position and road type.
- Insurers, fleets and traffic agencies use the data for pricing, training and finding hotspots. Privacy depends on consent, anonymization and aggregation.
- Video evidence adds context that numbers alone lack, which is the idea behind turning a phone into a dashcam.
Table of Contents
- What driver behavior data actually is
- The signals that make up the data
- How the data is collected
- How the data is analyzed
- How reliable is the data?
- Who uses driver behavior data, and for what
- Privacy, consent and security
- Our perspective
- Turn your phone into a source of useful driving data
- FAQ
- Sources
What driver behavior data actually is
The IEEE Technology Navigator defines driver behavior as the study and quantitative description of how drivers perceive the road, make decisions and act on the vehicle controls. That covers three levels:
- Control actions: steering, throttle and braking, the moment-to-moment inputs.
- Tactical choices: gap acceptance, lane changing and speed selection.
- Strategic choices: which route to take and when to leave.
The same source draws a useful line between performance and behavior. Performance is what a driver can do under test conditions. Behavior is what that driver does on an ordinary Tuesday commute. That is why data collected from everyday, uninstructed trips is valued more than lab measurements alone.
The stakes are practical. The Federal Highway Administration's SHRP2 safety FAQs state that driver behavior contributes to more than 90 percent of crashes and is the primary factor in more than 60 percent. If behavior is the main variable, measuring it is the main lever for prevention.
The signals that make up the data
The Washington Traffic Safety Commission's 2026 report describes telematics as real-time vehicle and driver behavior data from GPS, telematics devices, onboard sensors and smartphones, including speed, acceleration, braking, cornering and phone distraction. In practice the signals fall into a few groups.
| Signal group | Typical measurements | What it tells you |
|---|---|---|
| Motion | Acceleration, braking, cornering force (accelerometer, gyroscope) | Smoothness, harsh events, aggressive maneuvers |
| Position | GPS location, speed, route, time of day | Speeding, road type, exposure to risky hours |
| Phone use | Handheld calls, screen handling, app use | Distraction |
| Video | Forward and in-cabin images | Context: who did what, and why |
| Vehicle network | Turn signal state, pedal and speed data | How the driver used the controls |
| Physiological | Heart rate, eye measures, skin conductance | Fatigue and cognitive load (mostly research settings) |
The physiological group is mostly a research tool. A 2019 review by Lohani, Payne and Strayer lists EEG, heart rate variability, skin conductance and pupillometry among the common measures of cognitive state in real-world driving. A 2021 survey organizes monitoring indicators by driver, vehicle and environment, which is a handy way to think about any dataset: who is driving, what the car did, and what the road was like.
How the data is collected
Research-grade instrumented vehicles
The largest study of its kind is the SHRP2 naturalistic driving study. The FHWA reports that it fitted cars of 3,147 volunteer drivers with cameras, radar and other sensors, producing a database larger than 2 petabytes. A 2016 paper by Dingus and colleagues describes the setup: multiple video views, three-axis accelerometers and rate sensors, GPS, forward radar, turn signal state, vehicle network data and an incident push button. The same paper reports more than 35 million miles of continuous driving from participants aged 16 to 98.
Note the incident button. Even in a flagship study, the driver could mark a moment worth reviewing. Consumer apps with a Bluetooth button borrow the same idea.
Telematics devices and smartphones
A 2021 review in PMC says telematic devices typically monitor acceleration and deceleration, turning force, velocity and GPS, and are installed as black boxes, embedded systems or smartphone apps. It also notes the data volume is modest: roughly 5 to 15 MB a year per vehicle, depending on how often the car is used.
The Insurance Institute for Highway Safety (IIHS) reported in 2025 that safe-driving apps collect information from a phone or a tag on the vehicle, tracking speed, aggressive acceleration, hard braking and phone use. Some apps even detect when a driver picks up the phone using the accelerometer and gyroscope, the same sensors that count steps or rotate the screen.
Cameras
Sensors tell you that a hard brake happened. Video tells you why: a pedestrian stepped out, a car cut in, or the driver was late to react. This is why a smartphone mounted on the windshield is more than a recorder. It combines motion sensors, GPS and a camera in a device the driver already owns.
How the data is analyzed
Raw sensor streams are not useful until they are turned into events and scores. Systems generally follow the same pipeline:
- Clean and orient. Phone sensors are recalibrated to the vehicle's direction of travel so that "forward" and "sideways" mean the same thing in every trip.
- Detect events. Thresholds or machine-learning models flag hard braking, rapid acceleration, harsh cornering, speeding against the posted limit, and phone handling.
- Add context. Road type, time of day, weather and traffic change what an event means. A hard stop in a school zone is not the same as one on an empty highway.
- Score or classify. Events per mile are combined into a driving score, a risk rating, or a flag for review. In video-based systems, image models can classify actions such as safe driving or distraction.
- Aggregate. Individual trips roll up into driver profiles, fleet dashboards or road-segment heat maps.
The field itself blends traffic engineering, human factors psychology, control theory and machine learning, according to IEEE's overview. That mix explains why two scoring systems can rate the same trip differently: each picks its own thresholds and weights.
For road authorities, the output is spatial. The Governors Highway Safety Association's 2025 report describes Telematics Risk Analysis as a shift from reaction to prevention, helping officials spot problems such as repeated phone distraction on rural roads or high-speed driving through school zones before anyone is hurt.
How reliable is the data?
Good data users ask three questions: is the measurement accurate, is the sample representative, and is the context captured?
Accuracy. A 2012 controlled field study by Kehr and colleagues found that smartphone measurements tend to overestimate critical driving events compared with a vehicle-fixed sensor, possibly because the phone drifts from its calibrated starting position. They also found road type is a significant factor that many implementations ignore. The practical lessons:
- Mount the phone firmly and keep it in one position.
- Prefer systems that recalibrate during the trip.
- Interpret events together with road type and video, not in isolation.
Representativeness. Opt-in programs attract drivers who want to be measured. Naturalistic studies like SHRP2 work because drivers behave normally over long periods, which is the whole point of observing instead of testing.
Context. A number without a picture can mislead. A driver who brakes hard to avoid a collision did the right thing, and the data should not penalize it. Video and incident markers are how systems tell the difference.

Who uses driver behavior data, and for what
Vision Zero Network's 2025 write-up on telematics gives a clear picture of the ecosystem. It reports that one major platform tracks hard braking, speeding, phone distraction, aggressive maneuvers and harsh cornering from an opt-in network of more than 12 million monthly U.S. drivers, that rideshare companies use it to monitor trips and improve driver training, and that 23 of the top 25 U.S. auto insurers integrate it into usage-based insurance with discounts for safe drivers. City and state agencies use it to find risky-behavior hotspots for traffic calming, street redesign and speed cameras.
By audience:
- Drivers get feedback on habits, and in many programs a discount for safe driving.
- Insurers get more accurate risk pricing and, after a crash, better evidence of what happened.
- Fleet operators use it for coaching, accountability and reducing incidents.
- Traffic authorities use aggregated data to place enforcement and fix dangerous road designs.
- Researchers use it to understand crash causes. The Governors Highway Safety Association notes that distracted driving caused an estimated 12,405 deaths in 2021, 28% of all traffic fatalities, which is the kind of problem behavior data is meant to address.
Privacy, consent and security
Driving data is personal: it shows where you go and when. Responsible programs handle it in four ways.
- Consent. The 2021 PMC review notes that the European Data Protection Board recommends that manufacturers give users a way to agree, reject or delete specific data types. In the EU, the same review identifies the ePrivacy Directive and the GDPR as the governing rules for in-vehicle data. If you drive outside the U.S., check the rules where you live.
- Anonymization and aggregation. IIHS says the telematics data it works with is anonymized and that data from many drivers is aggregated before sharing with researchers, so it cannot be tied to a particular person.
- Oversight. SHRP2 data collection ran under six institutional review boards, and researchers must hold qualified status and sign a data sharing agreement before using identifying information.
- Minimum necessary data. Collect what the safety purpose needs, and share the rest only in aggregate.
When you choose an app, read what it collects, who receives it, and whether you can delete it.
Our perspective
Most driver behavior data answers one question: how risky is this driver? We think there is a second question that matters just as much: what happened on this road, and who can act on it?
A hard-braking event tells you little by itself. Video tells you everything. That is why we built DashcamU around a smartphone that works as a dashcam, so the numbers always come with a picture, and the picture can reach the people who can use it: authorities for violations, and rescue and medical services after a crash.
We design our crash detection to respond in moments that count, and we report 98.2% accuracy for it. We also believe drivers will take part only if they trust the system, so anonymity is built into how reports are submitted, and we aim to reward drivers whose submissions result in a penalty, because road safety work should not depend on goodwill alone.
Aggregated, authentic and anonymous: those are the three properties we think driver data needs if insurers, cities and drivers are all going to rely on it.
Oleksiy
Turn your phone into a source of useful driving data
If you want to put your own phone to work, DashcamU turns a smartphone into a dashcam that records your drive, detects crashes automatically and lets you submit traffic violations anonymously. It also offers nearby accident alerts and works with Bluetooth buttons and DVRs, so you can mark a moment the way research vehicles do with an incident button.

See how it works on the DashcamU app page or start from the DashcamU home page.
FAQ
What is an example of driver behavior data?
A hard-braking event is a typical example: a timestamp, a location, a speed and a deceleration value, sometimes with a video clip. Other examples are speeding against the posted limit, harsh cornering and handheld phone use. Together they describe the habits of one driver or the risk on one stretch of road.
How do phones measure driving behavior?
Phones combine GPS with the accelerometer and gyroscope. GPS gives speed and location, while the motion sensors show braking, acceleration and turning. IIHS notes that the same sensors can reveal phone handling while driving. A camera adds video for context.
Is driver behavior data accurate?
It can be very useful, but accuracy depends on the setup. A controlled study found phone readings can overestimate critical events when the device moves from its calibrated position. A secure mount, recalibration and video context all improve reliability.
Is my driving data private?
That depends on the program. Well-run ones obtain consent, anonymize the data and aggregate it before sharing, as IIHS describes for its research data. Read the privacy terms of any app, and check local law, such as the GDPR in the EU.
Who uses driver behavior data?
Insurers use it for usage-based pricing, fleets for coaching, researchers for crash studies, and agencies to find hotspots. Vision Zero Network reports that most of the top U.S. auto insurers use telematics in discount programs.
Sources
- Driver behavior, IEEE Technology Navigator
- Using Telematics Data for Traffic Safety, Washington Traffic Safety Commission, 2026
- Survey and Synthesis of State of the Art in Driver Monitoring, PMC, 2021
- A Review of Psychophysiological Measures to Assess Cognitive States in Real-World Driving, PMC, 2019
- Driver crash risk factors and prevalence evaluation using naturalistic driving data, PMC, 2016
- SHRP2 Safety Frequently Asked Questions, Federal Highway Administration
- Regulatory and Technical Constraints: An Overview of Vehicle Telematic Data, PMC, 2021
- Safe-driving apps open up a new information source for research, IIHS, 2025
- Driving behavior analysis with smartphones: insights from a controlled field study, 2012
- Unlocking the Power of Telematics & Technology for Safe Streets, Vision Zero Network, 2025
- A Data-Driven Action Plan for Safer Roads, Governors Highway Safety Association, 2025